
To anticipate future travel demand in Washington County, the Dixie MPO uses data on population projections, current land-use plans, existing roadway networks, transit services, and active transportation facilities. The data is input into a computer-based travel demand model that then provides travel demand outputs to aid in the transportation planning process.
Population projections are provided to the Dixie MPO by the Utah Governor’s Office of Economic Development. That Office relies heavily on the work of the Kem C. Gardner Policy Institute at the University of Utah to project population levels moving forward.
Utah Population Growth Projections
The MPO also relies on individual city and county master plans (links below) to define current land-use plans and forecast potential population densities throughout the plan horizon. Currently, the MPO is working on updating the 2015-2040 Regional Transportation Plan. The new plan horizons will be 2019-2050.
Hurricane City Planning and Zoning
Ivins City Building and Zoning
LaVerkin Zoning Map, and LaVerkin General Plan
St. George Planning & Zoning Maps
Santa Clara Building, Planning, and Zoning
Washington County General Plan
ACTIVE TRANSPORATION ACCESSIBILITY STUDY:
Active Transportation Accessibility Study
Safe Streets for All
Overview
The Five County Association of Governments (FCAOG) in consultation with state and local government partners led the development of a comprehensive transportation safety plan to address serious and fatal crashes in Washington County. The FCAOG safety plan was developed with funding from the Safe Street for All (SS4A) discretionary grant program, established by the Bipartisan Infrastructure Law (BIL).
The Five County Association of Governments has adopted the plan through the Dixie Metropolitan Planning Organization Transportation Executive Committee board’s long-ranging planning process as of September 17th, 2024. This will allow local jurisdictions access to the Safety Action Plan elements which allows for more opportunity to apply for SS4A implementation grant funds and other review for future safety improvement in the Washington County area.
The final Washington County Comprehensive Safety Action Plan can be found in the GIS Storymap.
Any comments or questions about the Plan can be directed to the Dixie Metropolitan Planning Organization at fivecounty.ss4a@gmail.com.
Safety Action Plan Development Process
High Injury Network
An analysis of five years of historical crash data (2018 – 2022) involving fatalities and serious injuries was completed. The data was used to compile the Washington County High Injury Network, which identifies 150 road segments in the county with the highest rate of severe crashes. The High Injury Network reflects over 95% of the severe crashes in the county. Below is a link to the interactive HIN map.
High Injury Network (HIN) & Severe Crash Locations
In addition to analyzing crash data, the team also surveyed county residents and visitors on transportation preferences and safety. The 1,663 responses provided input on travel modes, safety perceptions, preferred safety improvements, and demographic information. The community survey results are available in the two interactive dashboards below:
Public Trends: Modes, Perceptions and Solutions Dashboard
Location Based Safety Concerns Dashboard
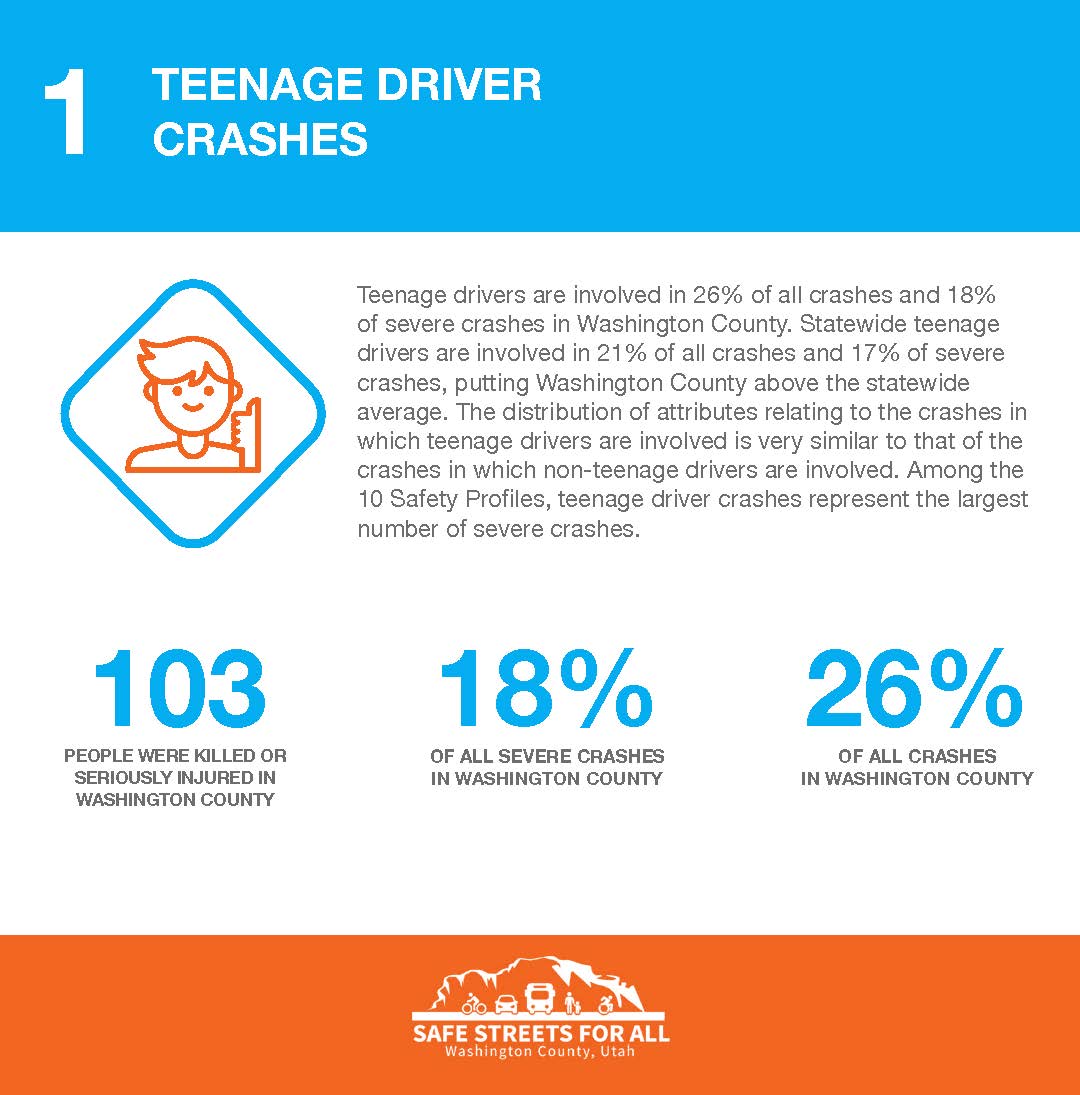
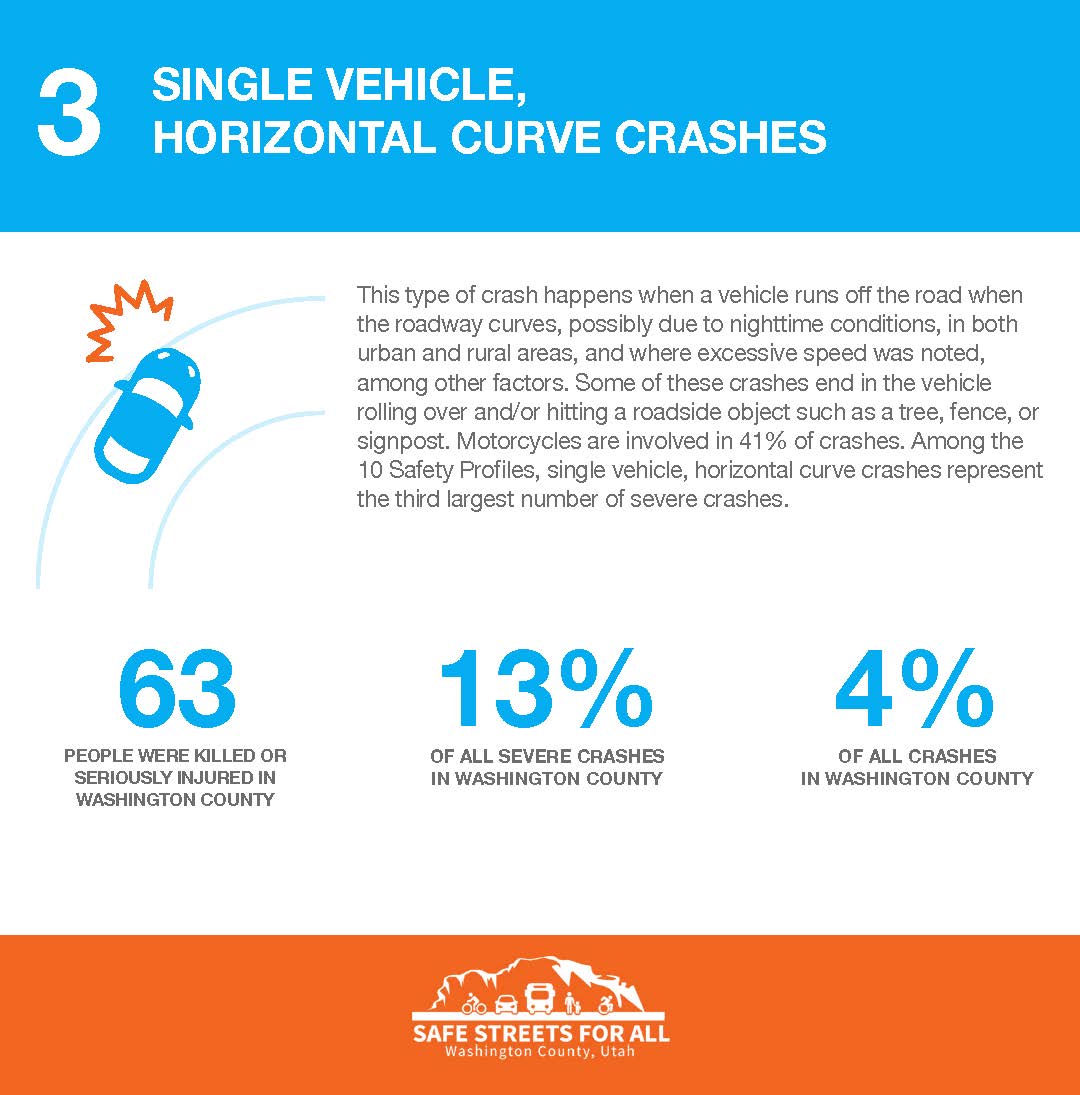
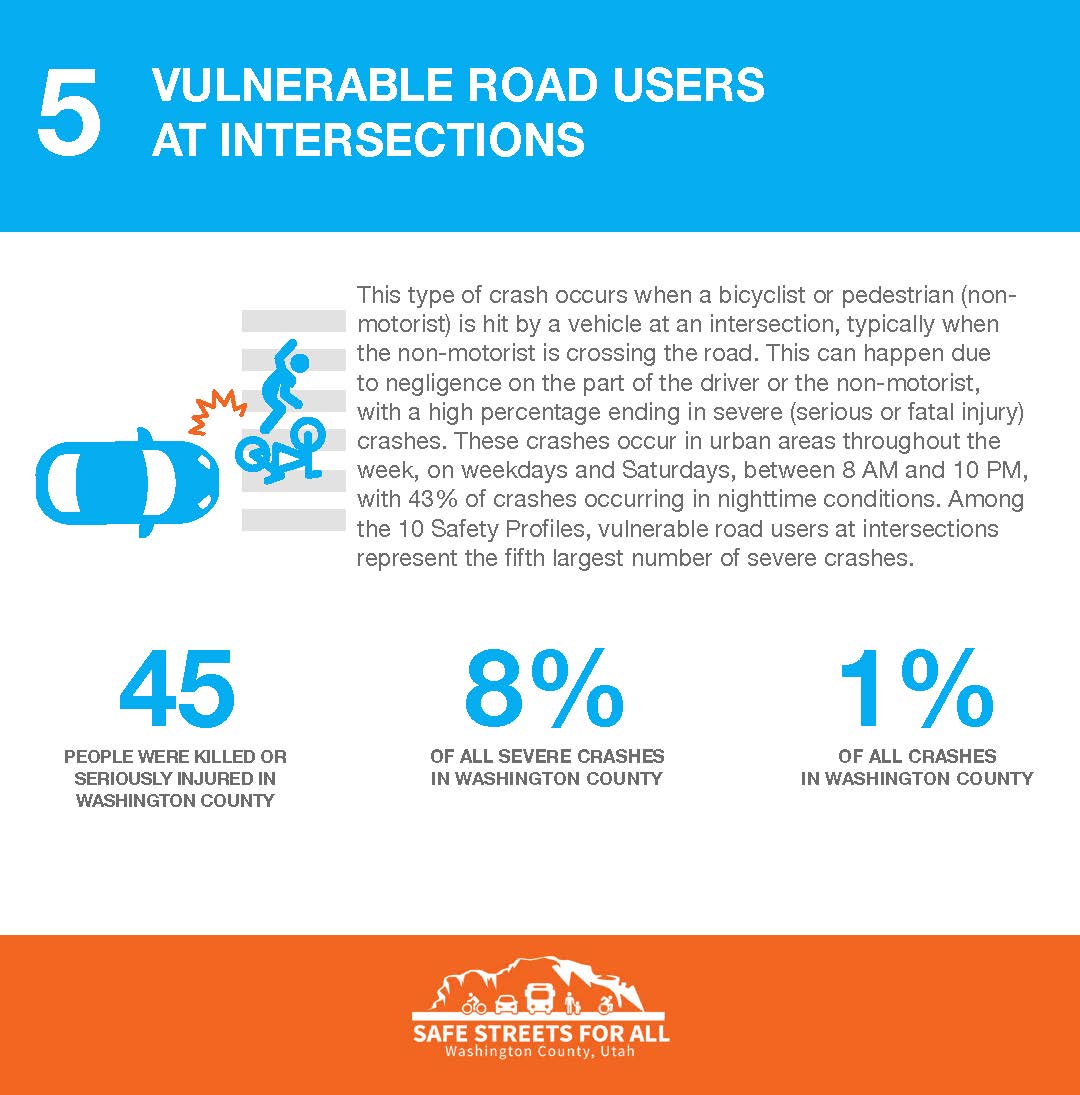
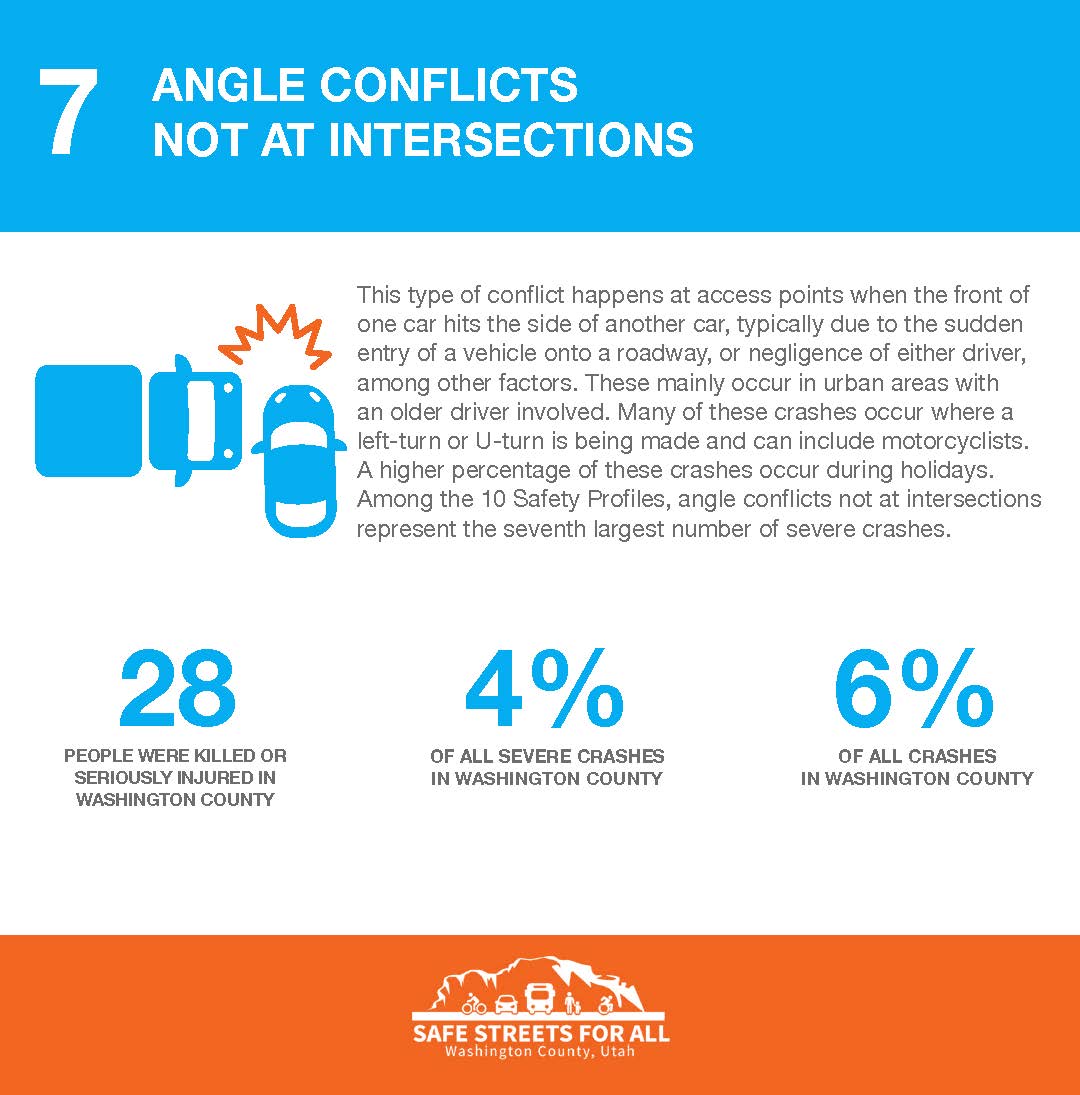
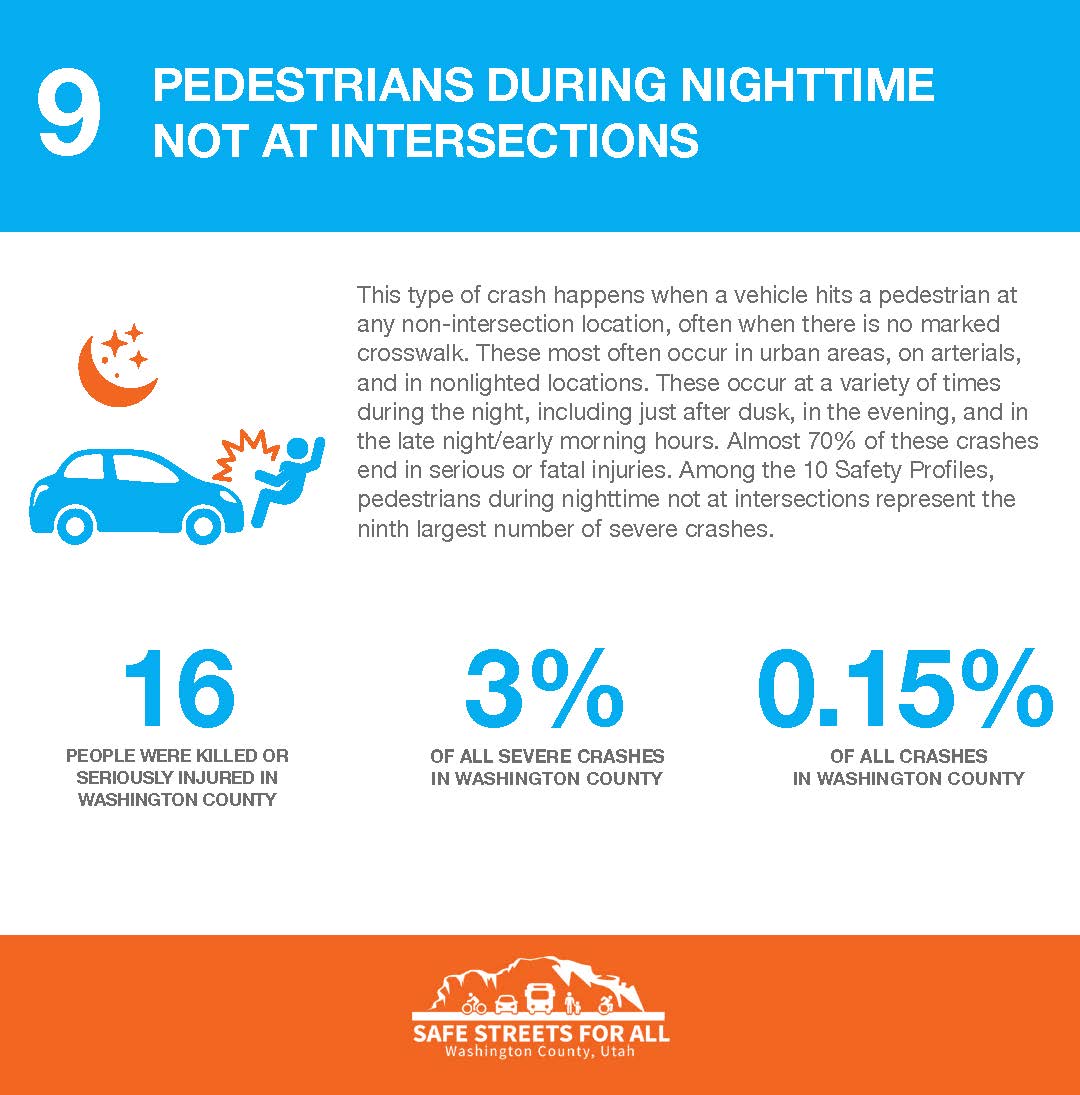
Safety Profile Toolkit
The identified factors contributing to the crashes contained in the historical crash data (2018 – 2022) were also analyzed. Ten Safety Profiles were created from the factors that contributed to over 70% of local severe crashes.
Countermeasures
A list of potential countermeasures for each of the Safety Profiles was compiled that could be implemented to improve safety for each of the crash types described. The types of countermeasures are organized into four main tiers:
Tier 1 – Remove Severe Conflicts in Space
Tier 2 – Reduce Vehicle Speed
Tier 3 – Manage Conflicts in Time
Tier 4 – Increase Attentiveness and Awareness
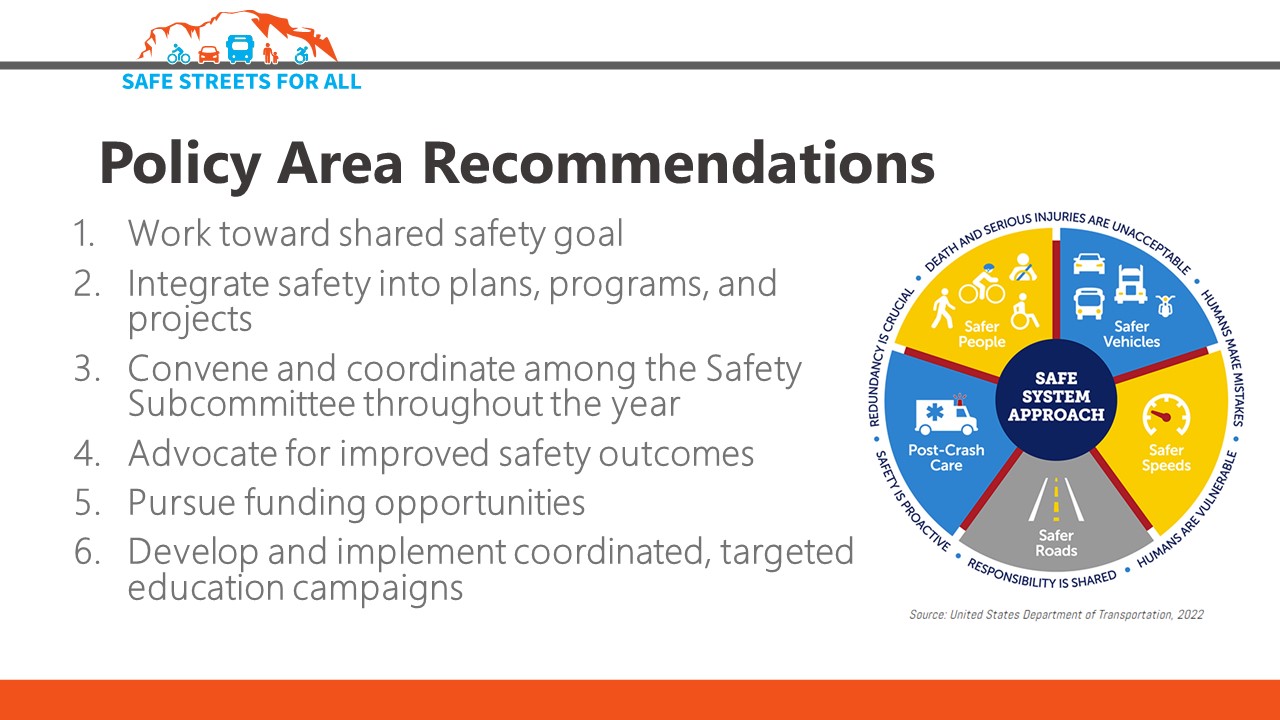
These four tiers support the Safe System Approach categories of Safer Roads, Safer Speeds, and Safer People. Additionally, some of the potential countermeasures relate to the Safe Systems Approach category of Post Crash Care.
Policy Area Recommendations
In addition to the High Injury Network and Safety Profile Toolkit, the team also provided several Policy Area Recommendations to promote safety improvements moving forward.
Final Safety Action Plan
The final SS4A Safety Action Plan, including the Safety Profile Toolkit and the HIN Segment Analysis of 12 of the top High Injury Network segments are available in the GIS Storymap.
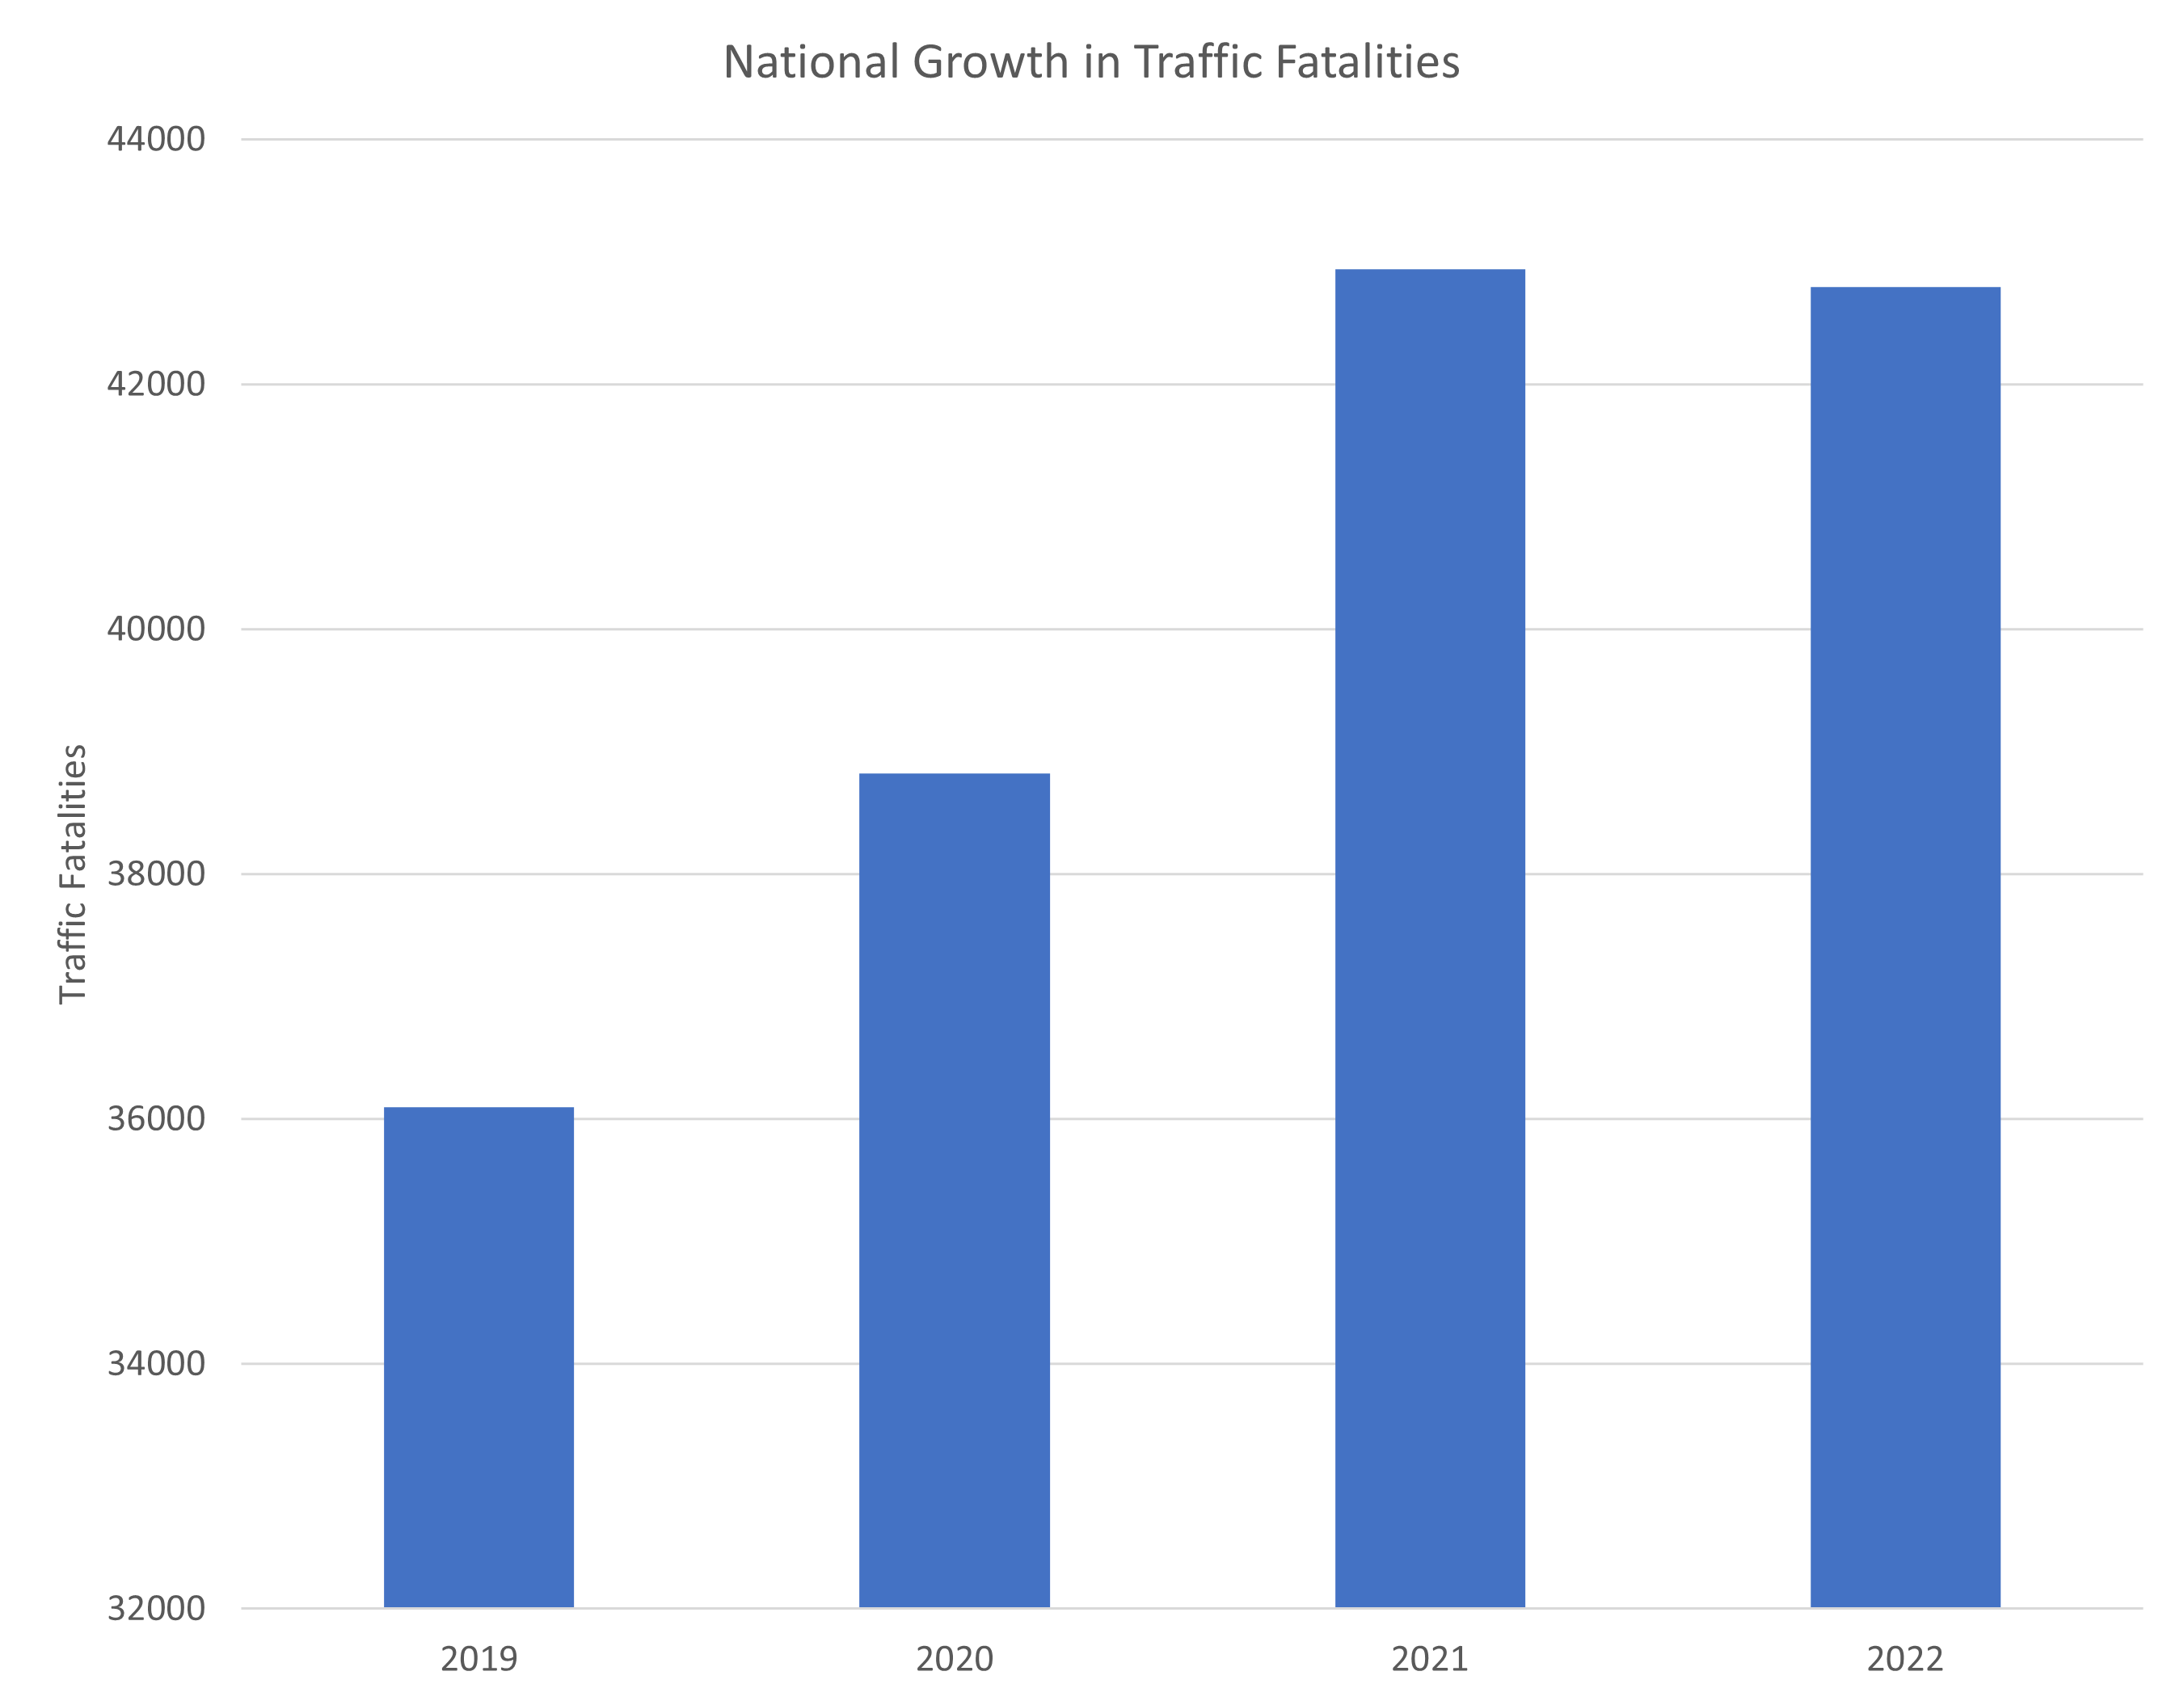
Crash Trends
In recent years, fatal and serious crashes have grown at exceptional rates nationally. While travel dropped by 1% between 2019 and 2022, national traffic fatalities grew 19%.
The increase in fatal and serious crashes in Washington County has been consistent with national trends. Severe crashes (fatal and serious injury) make up a small percentage of total crashes, but they have increased by 68% in Washington County since 2019.
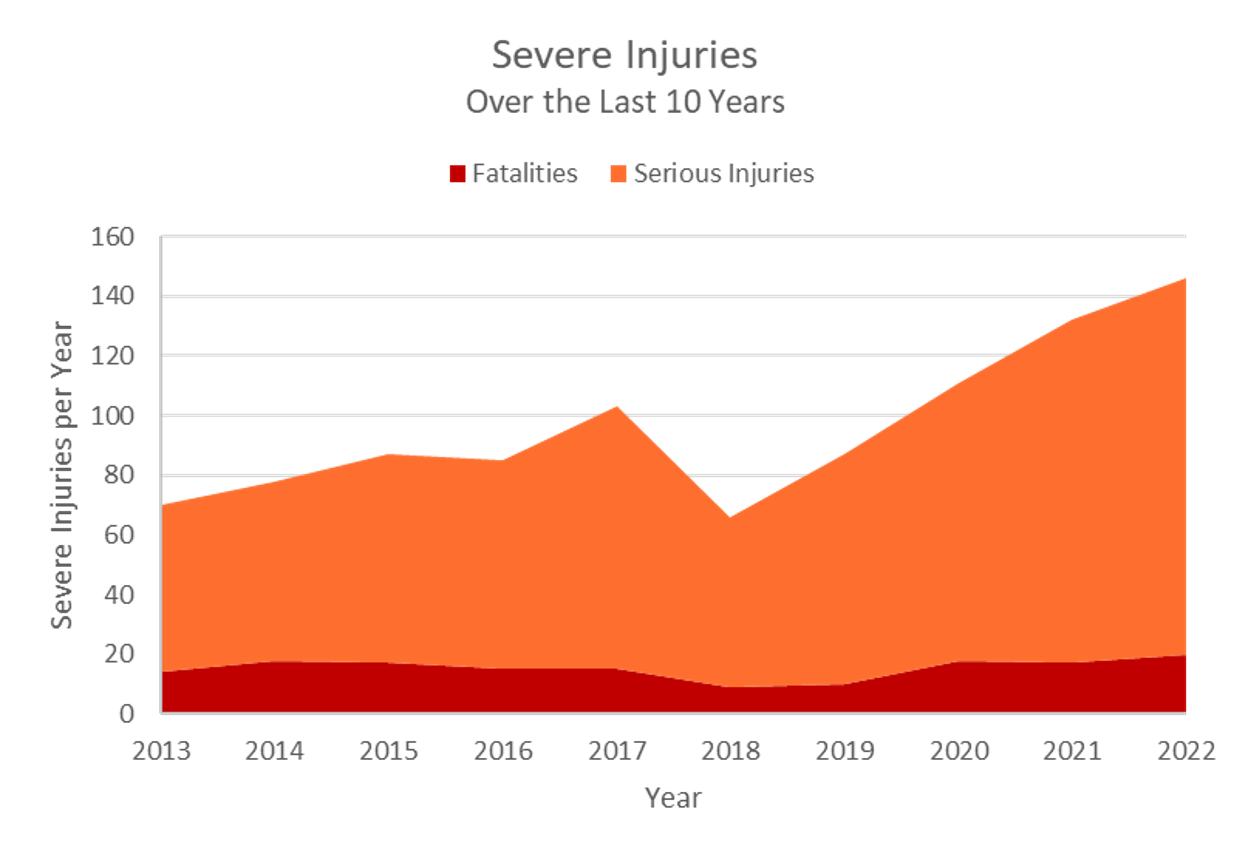
Similar to Utah statewide trends, Washington County has higher rates of severe crashes during the summer, but unlike statewide trends, the county has peaks in severe crashes in spring (April) and fall (October). The rate of severe crashes in the county significantly increases for weekend days Saturday and Sunday. Table 1 provides the modal distribution of all severe injuries in Washington County from 2013 through 2022.
Vision Zero Goal
Table 1 – Summary of Annual Severe Injuries by Mode in Washington County
| Number of Severe Injuries | Percent of Severe Injuries | ||||||
| Year | Pedestrian | Bicyclist | Vehicle Driver or Passenger | Total | Pedestrian | Bicyclist | Vehicle Driver or Passenger |
| 2013 | 3 | 1 | 66 | 70 | 4% | 1% | 94% |
| 2014 | 5 | 7 | 66 | 78 | 6% | 9% | 85% |
| 2015 | 6 | 4 | 77 | 87 | 7% | 5% | 89% |
| 2016 | 5 | 1 | 79 | 85 | 6% | 1% | 93% |
| 2017 | 10 | 3 | 90 | 103 | 10% | 3% | 87% |
| 2018 | 12 | 3 | 51 | 66 | 18% | 5% | 77% |
| 2019 | 7 | 3 | 77 | 87 | 8% | 3% | 89% |
| 2020 | 8 | 4 | 99 | 111 | 7% | 4% | 89% |
| 2021 | 15 | 4 | 113 | 132 | 11% | 3% | 86% |
| 2022 | 14 | 8 | 124 | 146 | 10% | 5% | 85% |
Summary of Annual Severe Injuries by Mode in Washington County 2013-2022
The Council of Governments and Washington County Commission approved a Vision Zero goal of achieving zero fatalities and serious injuries through a 5% yearly reduction in the county.
As depicted in Table 2, a 5% annual reduction in severe crashes achieves a nearly 70 percent reduction in severe crashes by 2045. Meeting the goal of reducing severe crashes by 5% each year will require a focused safety program to cultivate a strong safety culture in the county and to pursue funding opportunities for safety improvements.
Table 2 – Example of the Percent Reduction in Severe Injuries
| 5 Percent Goal | ||
| Year | Severe Injuries | Percent Reduction from 2022 |
| 2022 | 146 | – |
| 2035 | 75 | 49% |
| 2045 | 45 | 69% |
Example of the Percent Reduction in Severe Injuries with 5% annual reduction goal
